Simple Network Management Protocol(SNMP) on a Raspberry Pi
How to use SNMP to expose a custom metric on a Raspberry Pi using Prometheus and display on Grafana
Prerequiste
- A Raspberry PI or any device that support SNMP
- Connection to the SNMP device
SNMP Quick Overview
Origin
- SNMP or Simple Network Management Protocol was created to be used for device management in a network. However, due to security concern arise from Version 1 and Version 2 of SNMP, SNMP start to be used less for management and more for monitoring. To be honest, who would risk exposing an unsecured protocol for management?
- To overcome this, SNMP version 3 is released with advanced authentication support which is the version we will use in this article.
MIBs and OIDs
- I like to think these two terms as phone book (MIB) and phone number(OID).
- To make a call to find out if your aunt is okay, you look into the phone book just like in SNMP, to know about an OID value, MIB can be analysed. MIB also store every information about the OID, just like real phone book.
- There are multiple MIBs just like there are many phone books, each MIB is suitable for a set of devices. For example, MIB that is created from a router vendor may not be able to be used on another device. You can search online for a suitable MIB for your machine.
- For this article, I will use one OID from UCD-SNMP-MIB MIB and one OID from a custom metric.
Install SNMP service
-
My Raspberry Pi doesn't have SNMP service in advance so I will need to install it first. If your device already has one, you can skip this
-
First, I connect to my Raspberry Pi using SSH
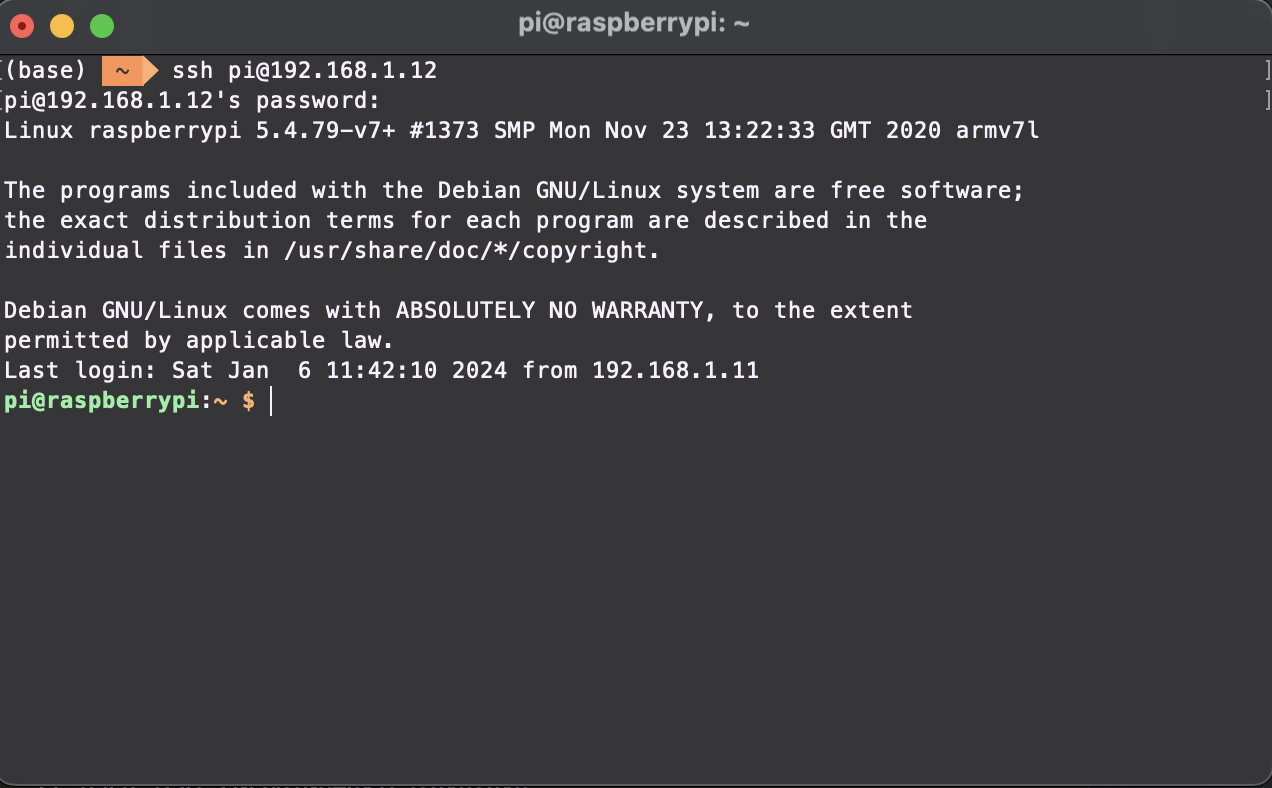
-
Then I run this command to download and install SNMPD service
sudo apt -y install snmpd snmp libsnmp-dev
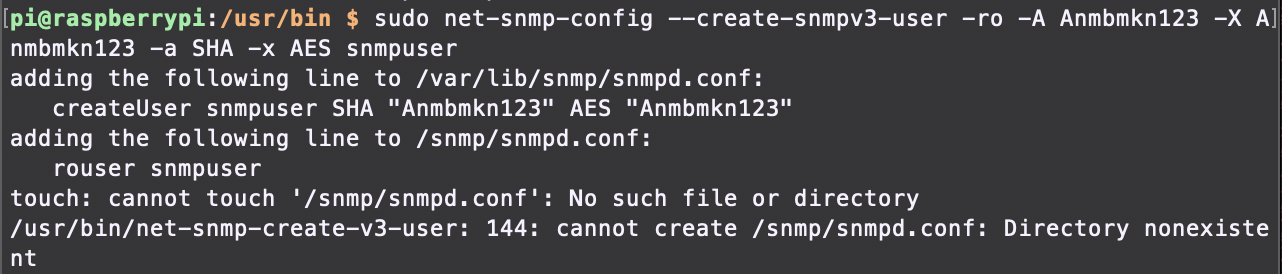
- As we use SNMP V3, we will need to create a new account to be used for authentication. We need to stop the service before we can add. Replace the username and password with your own.
sudo systemctl stop snmpd
sudo net-snmp-config --create-snmpv3-user -ro -A {AuthPassword} -X {EncryptPassword} -a SHA -x AES {snmpuser}
Note, just ignore the error below if you encounter one. This is a bug if you run snmpd service on ARMv6 on Raspberry Pi
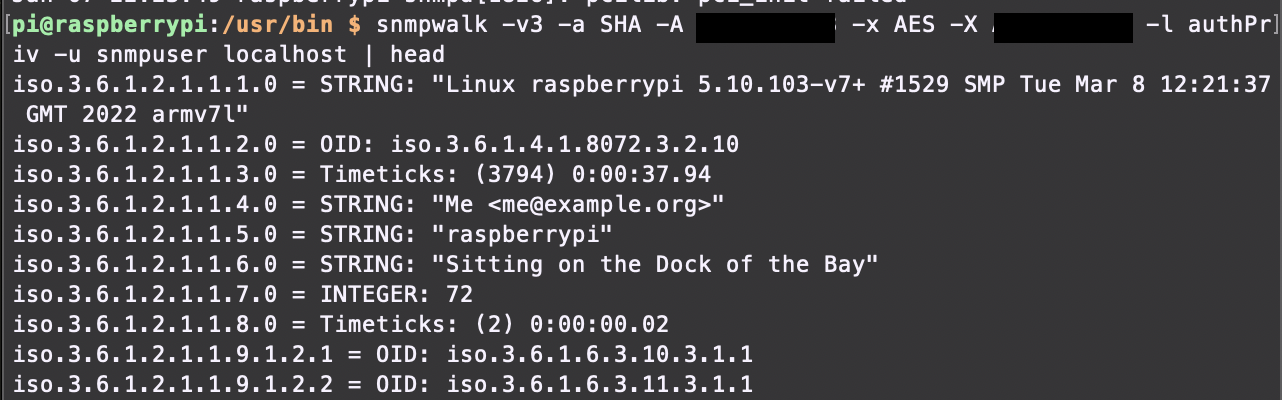
- To test if your SNMP service is running, we can use snmpwalk to walk the OID for its value. Remember to replace with your username and password value
snmpwalk -v3 -a SHA -A AuthPassword -x AES -X EncryptPassword -l authPriv -u snmpuser localhost | head
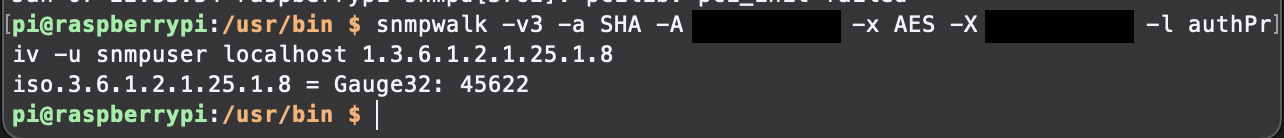
- To walk specific OID, use this command
snmpwalk -v3 -a SHA -A AuthPassword -x AES -X EncryptPassword -l authPriv -u snmpuser localhost .1.3.6.1.4.1.2021.11.11.0
Custom OID
- What if there is no OID that expose the metric you want or you use a custom metric? We can create our own OID!
- First, we need to create our own metric. I will create a script that will display my Raspberry Pi temperature in Celsius
sudo nano /usr/local/bin/SNMP-Temperature-Sensor-CPU
- This is the script's content.
#!/bin/bash
if [ "$1" = "-g" ]; then
echo 1.3.6.1.2.1.25.1.8
echo gauge
cat /sys/class/thermal/thermal_zone0/temp | awk '{print $1/1000}'
fi
exit 0
-
To know which OID you can use, simply use the snmpwalk command above and change the OID until you get an error which means the OID is not in use.
-
Update the execution permission
sudo chmod +x /usr/local/bin/SNMP-Temperature-Sensor-CPU
- Then, we need to update the configuration of SNMP service to reply call on our custom OID with the script result.
sudo nano /etc/snmp/snmpd.conf
- Add this entry to the file, change the OID to yours if you use a different one. The third part is the path to your metric script, update it if needed.
pass 1.3.6.1.2.1.25.1.8 /bin/sh /usr/local/bin/SNMP-Temperature-Sensor-CPU
- Restart snmp service to apply the change. Once done, you can walk the new OID to check if your metric works. I haven't updated my script at this point so the temperature was still being displayed in thousands...
SNMP Exporter
- Exporter is a concept introduced by Prometheus to make any metric readable by Prometheus server. The same apply for SNMP Exporter, export readable SNMP data to Prometheus.
- My Raspberry Pi has problem running SNMP Exporter so I need to run on my Macbook.
- Installation is easy, SNMP Exporter provides binary download option that you can just run out of the box. Download it here
SNMP Exporter Generator
- To run SNMP Exporter, we need to tell it what OID we want it to walk. For this we can write to a config file(usually snmp.yml)
- I'm planning to use only 2 OIDs but imagine if we want to expose everything in your favorite MIB for example, this cannot be done manually.
- Fortunately, SNMP Exporter also provides a generator that receive a list of OID, search it inside a list of MIBs and generate a snmp.yml config file that we can then fetch to SNMP Exporter.
- The generator is packaged with the SNMP Exporter source code. We can pull the whole project and run it.
git clone https://github.com/prometheus/snmp_exporter.git
cd snmp_exporter/generator
make generator mibs
- Without specifying OIDs, the generator will implicitly understand that we want to use every OIDs in every MIBs which obviously is a lot. The MIBs are fetched from the same folder
/mibs. - I don't need that many OIDs, for this we can give the generator a list of OIDs we want to use. Also, because we will use authentication, we also need to provide the credentials inside the
snmp.ymlfile. SNMP Exporter will use this credential to query the SNMP device.
sudo nano generator.yml
auths:
  public_v3:
    version: 3  # SNMP version to use. Defaults to 2.
                # 1 will use GETNEXT, 2 and 3 use GETBULK.

    # v3 has different and more complex settings.
    # Which are required depends on the security_level.
    # The equivalent options on NetSNMP commands like snmpbulkwalk
    # and snmpget are also listed. See snmpcmd(1).
    username: YourUsernameHere  # Required, no default. -u option to NetSNMP.
    security_level: authPriv  # Defaults to noAuthNoPriv. -l option to NetSNMP.
                                  # Can be noAuthNoPriv, authNoPriv or authPriv.
    password: YourPasswordHere  # Has no default. Also known as authKey, -A option to NetSNMP.
                    # Required if security_level is authNoPriv or authPriv.
    auth_protocol: SHA  # MD5, SHA, SHA224, SHA256, SHA384, or SHA512. Defaults to MD5. -a option to NetSNMP.
                        # Used if security_level is authNoPriv or authPriv.
    priv_protocol: AES  # DES, AES, AES192, or AES256. Defaults to DES. -x option to NetSNMP.
                        # Used if security_level is authPriv.
    priv_password: YourPasswordHere # Has no default. Also known as privKey, -X option to NetSNMP.
                             # Required if security_level is authPriv.
    context_name: context

modules:
  raspberry_pi:
    walk:
      - 1.3.6.1.4.1.2021.4.11
- You will notice that I didn't put my custom OID into the generator config file. This was because like I mentioned, the generator will search for the OID inside it's MIBs list. Obviously, our custom OID is not in it.
- Run this command to fetch the config into the generator run.
./generator generate -g generator.yml
- The generator will generate the
snmp.yml, copy this file and replace the defaultsnmp.ymlinside thesnmp-exporterbinary you download from the above step. - We can then add our own OID in this step, open
snmp.ymlfile and paste this into themetricspart
- name: cpuTemperature
      oid: 1.3.6.1.2.1.25.1.8
      type: gauge
      help: The CPU temperature - 1.3.6.1.2.1.25.1.8
- Finally, we can run the SNMP Exporter using this command.
./snmp_exporter --config.file=snmp.yml
- To access the exporter, go to port 9116 on the machine that run the exporter. Replace the
Targetbox with your SNMP device IP. For theAuthandModules, check your snmp.yml. For me, it would bepublic_v3andraspberry_pirespectively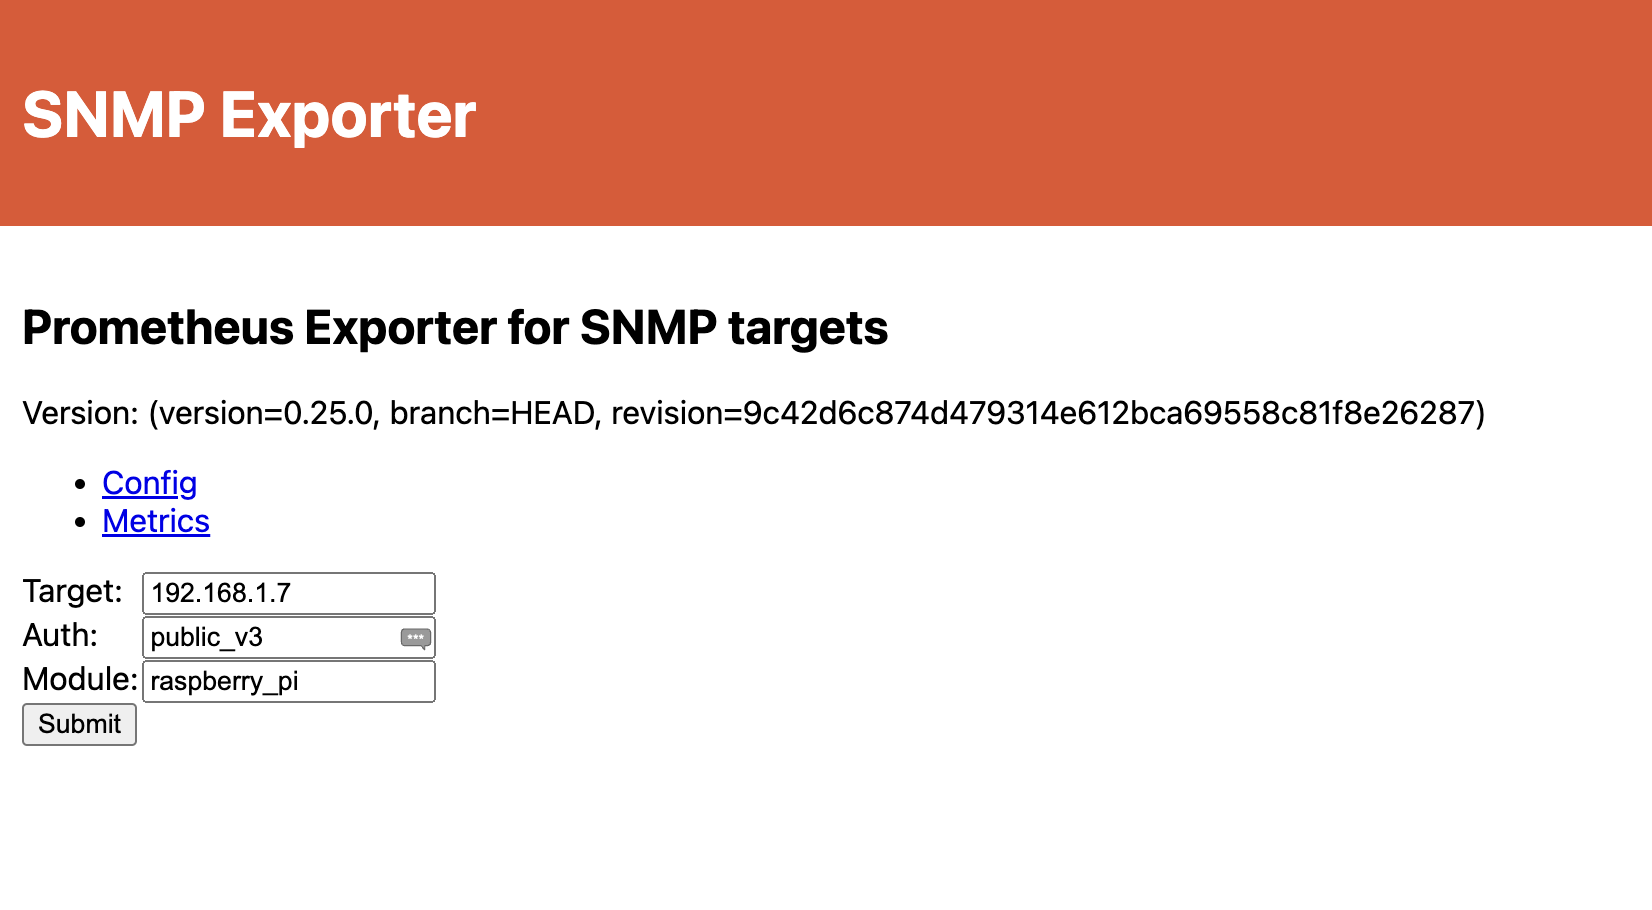
- When you click Submit, SNMP Exporter will use the Authentication you define inside
public_v3to walk the OIDs information insideraspberry_pimodule on SNMP service of device on192.168.1.7 - You can even run more customizable query. Check out all the possiblities here
Export to Prometheus
Install Prometheus
- Download a suitable Prometheus for yours here
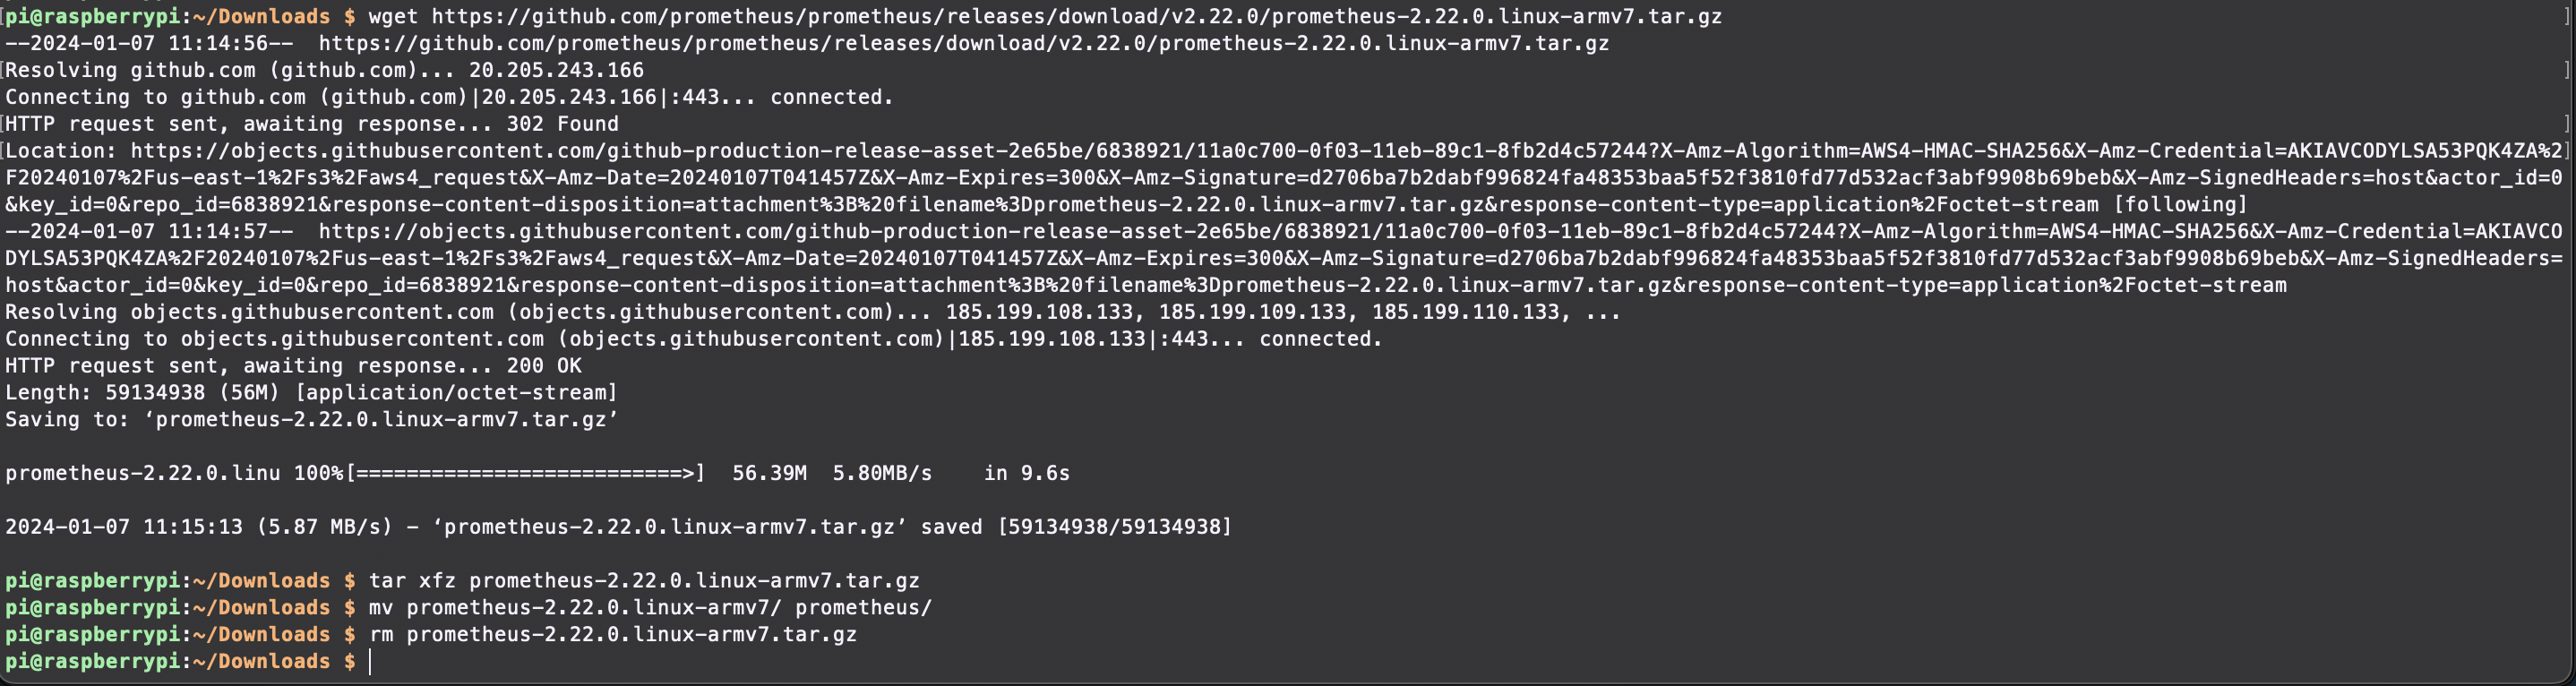
- For mine, I need to download the binary which means to add Prometheus as a service. We need to do more than
apt install. - I need to create a service file, basically I'm registering a custom service
sudo nano /etc/systemd/system/prometheus.service
- Add this content to the file, this means when the service is ran, the command inside
ExecStartwill run as Userpi.
[Unit]
Description=Prometheus Server
Documentation=https://prometheus.io/docs/introduction/overview/
After=network-online.target

[Service]
User=pi
Restart=on-failure

ExecStart=/home/pi/prometheus/prometheus \
  --config.file=/home/pi/prometheus/prometheus.yml \
  --storage.tsdb.path=/home/pi/prometheus/data

[Install]
WantedBy=multi-user.target
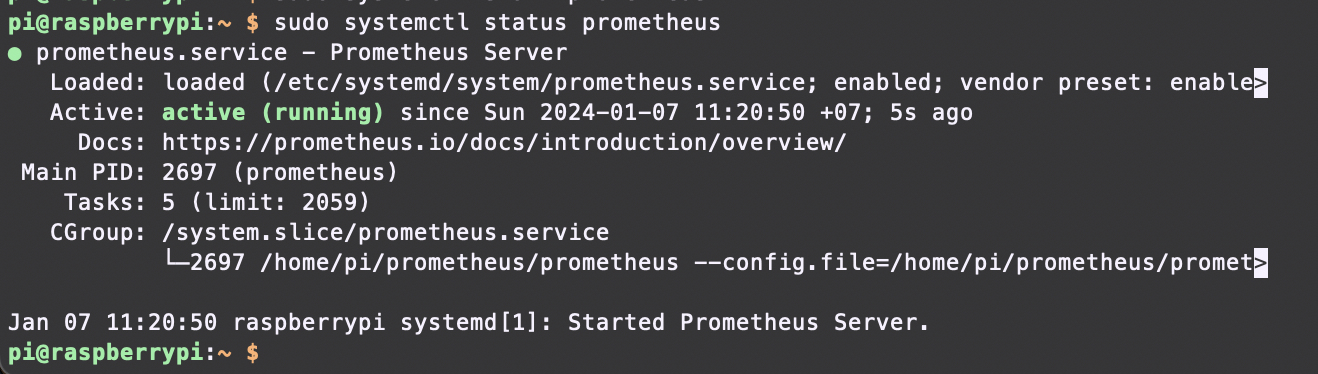
- Then, we can run these commands to auto start the service, start it and check for its status.
sudo systemctl enable prometheus.service
sudo systemctl start prometheus.service
sudo systemctl status prometheus.service
- Prometheus by default doesn't have SNMP Exporter as target. We need to register it by updating Prometheus configuration.
- My Prometheus configuration file or
prometheus.ymlis inside my downloaded Prometheus folder. Yours can be different. - Add this part to the
scrape_configspart ofprometheus.ymlfile
- job_name: 'snmp'
    static_configs:
      - targets:
        - 192.168.1.7 # Your SNMP Device IP
    metrics_path: /snmp
    params:
      auth: [public_v3] # Your Auth name
      module: [raspberry_pi] # Your Module name
    relabel_configs:
      - source_labels: [__address__]
        target_label: __param_target
      - source_labels: [__param_target]
        target_label: instance
      - target_label: __address__
        replacement: 192.168.1.11:9116 # Your SNMP Exporter
- Restart the Prometheus service and try to access it. On
Targetstab, you will be able to see your SNMP Exporter listed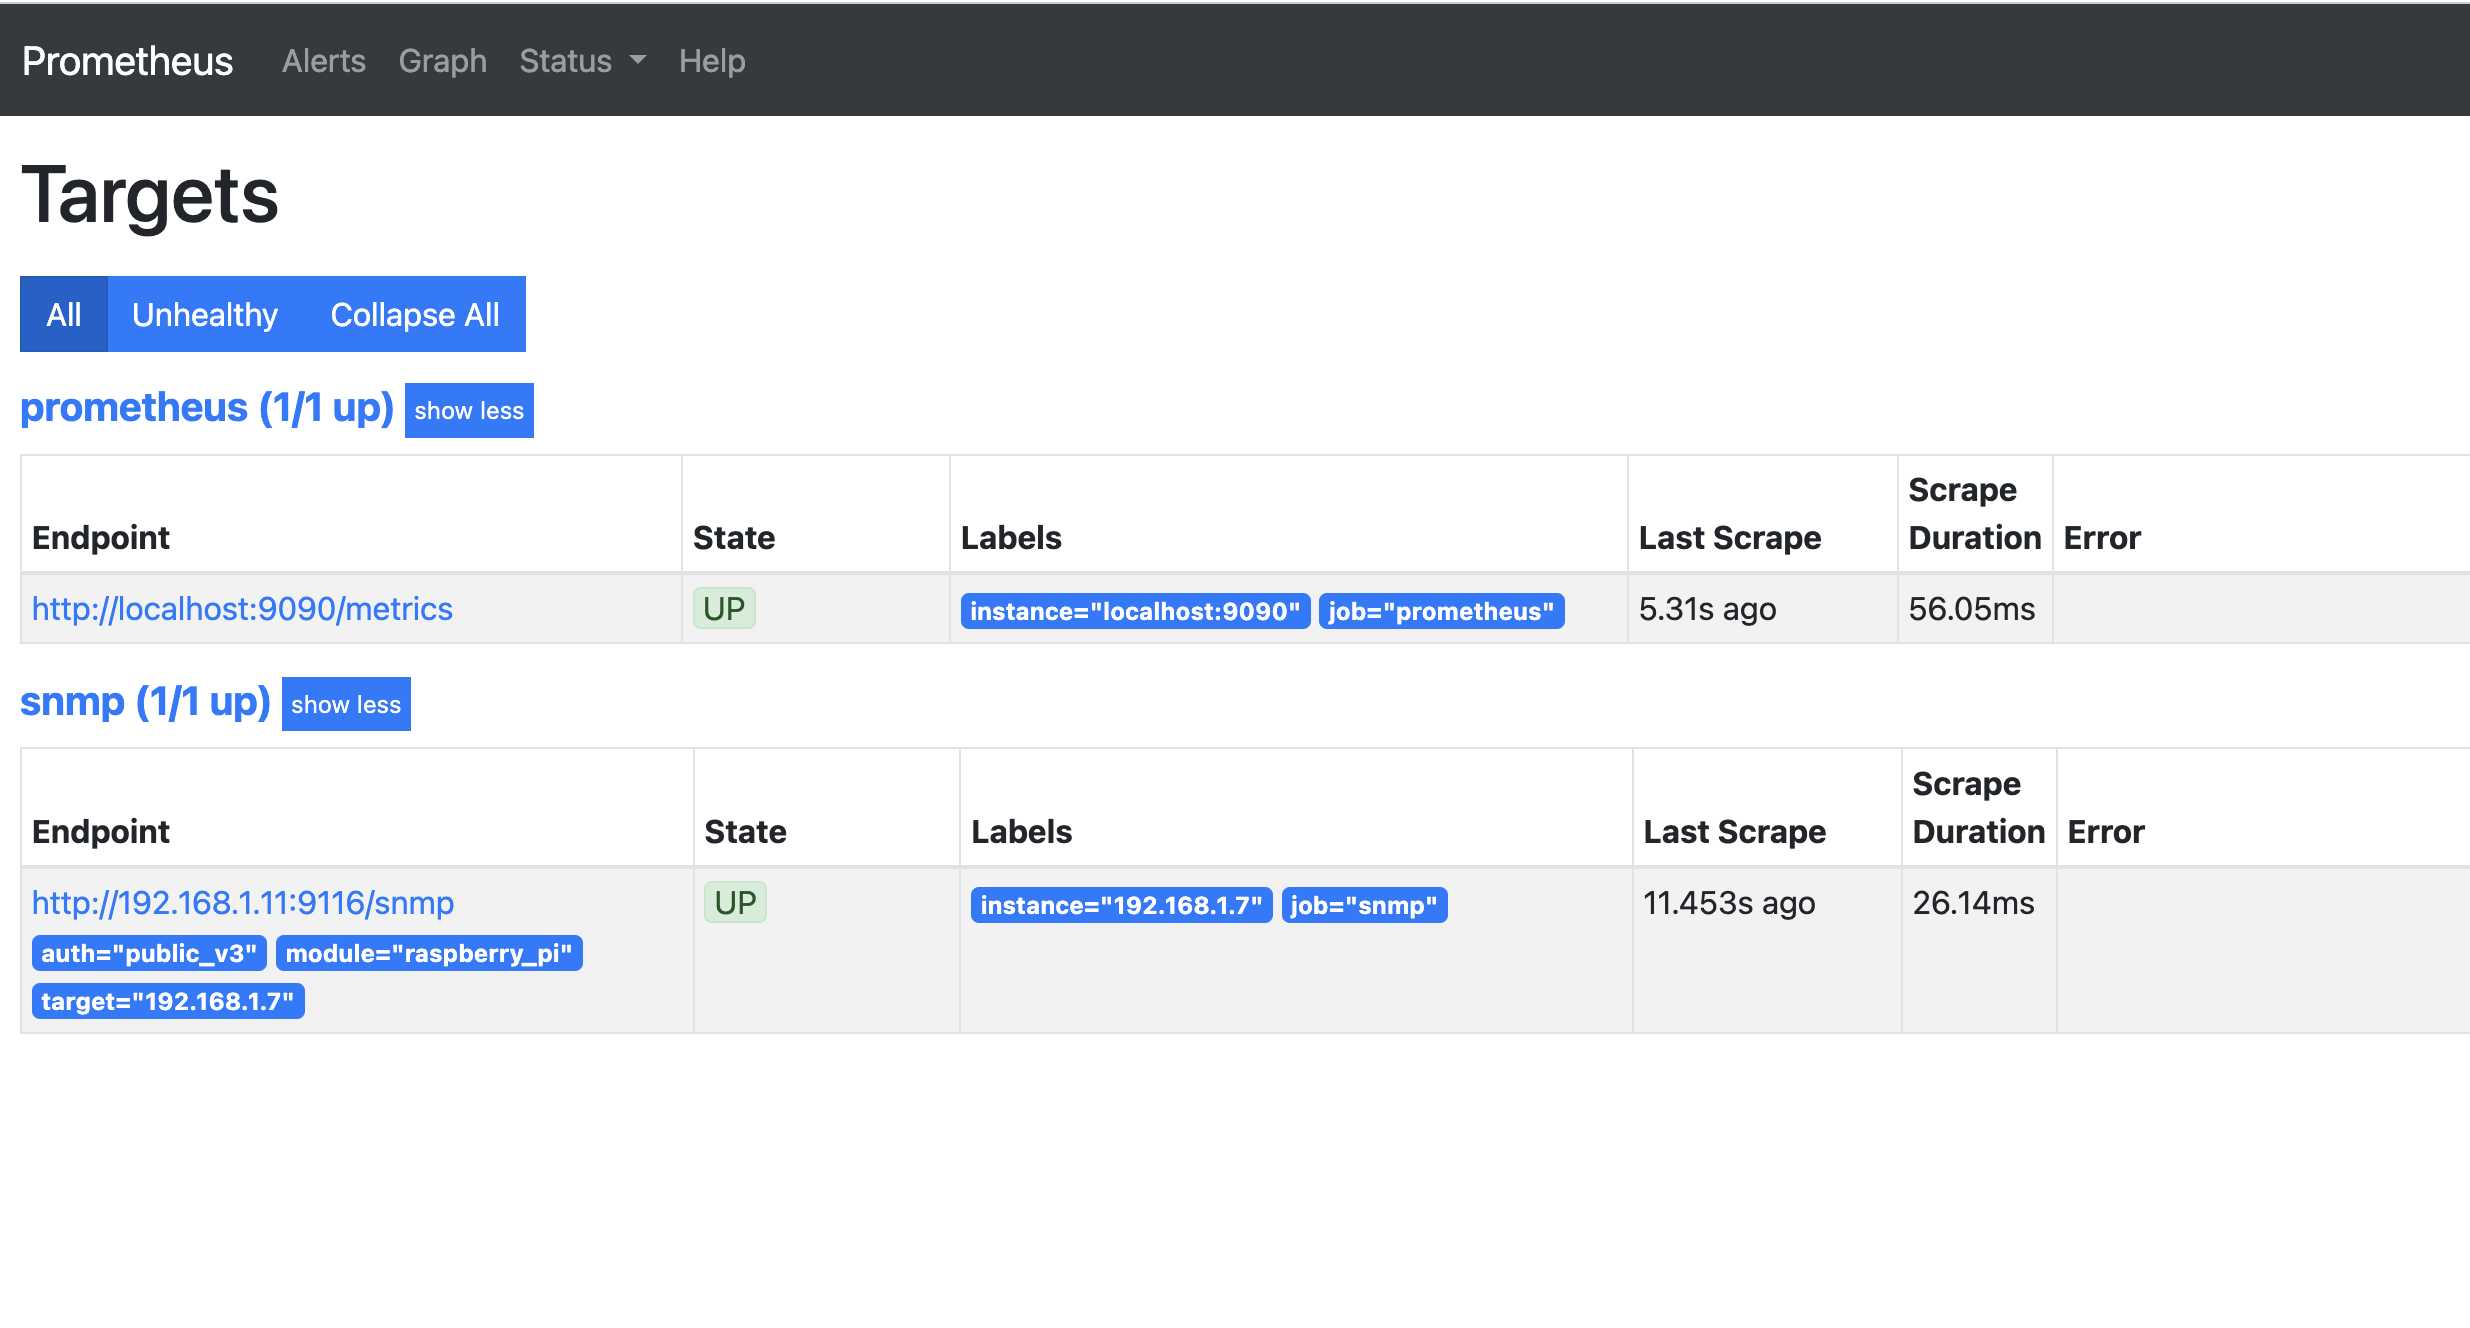
Grafana
- To be honest, it looks kinda boring as Prometheus is for data querying not much of display. We can use Grafana for this.
- Installing is straightforward like Prometheus as these tools are quite popular. You won't need to install like this if your package manager already has Grafana available.
sudo mkdir -p /etc/apt/keyrings/
wget -q -O - https://apt.grafana.com/gpg.key | gpg --dearmor | sudo tee /etc/apt/keyrings/grafana.gpg > /dev/null
echo "deb [signed-by=/etc/apt/keyrings/grafana.gpg] https://apt.grafana.com stable main" | sudo tee /etc/apt/sources.list.d/grafana.list
sudo apt-get update
sudo apt-get install -y grafana
sudo systemctl enable grafana-server
sudo systemctl start grafana-server
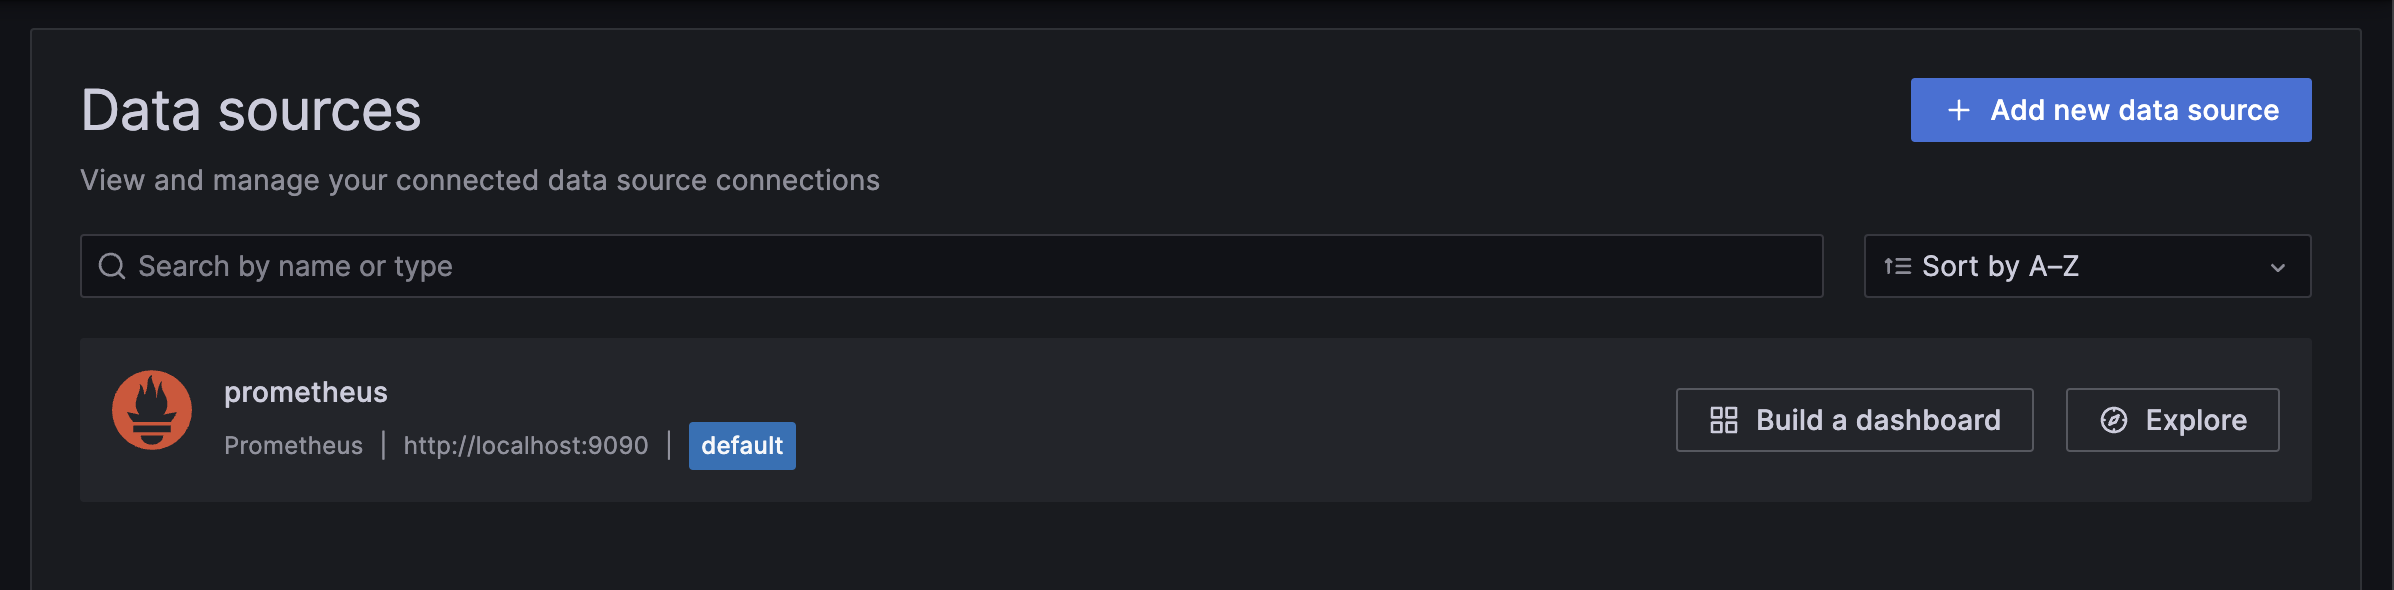
- Access the Grafana Dashboard on port 9000. The default credential are
admin/admin. You will be prompted to update your password once you are logged in. - To start displaying, Grafana need a data source which will be our Prometheus server. Add the Prometheus Server by using your Prometheus server IP. I have already added mine
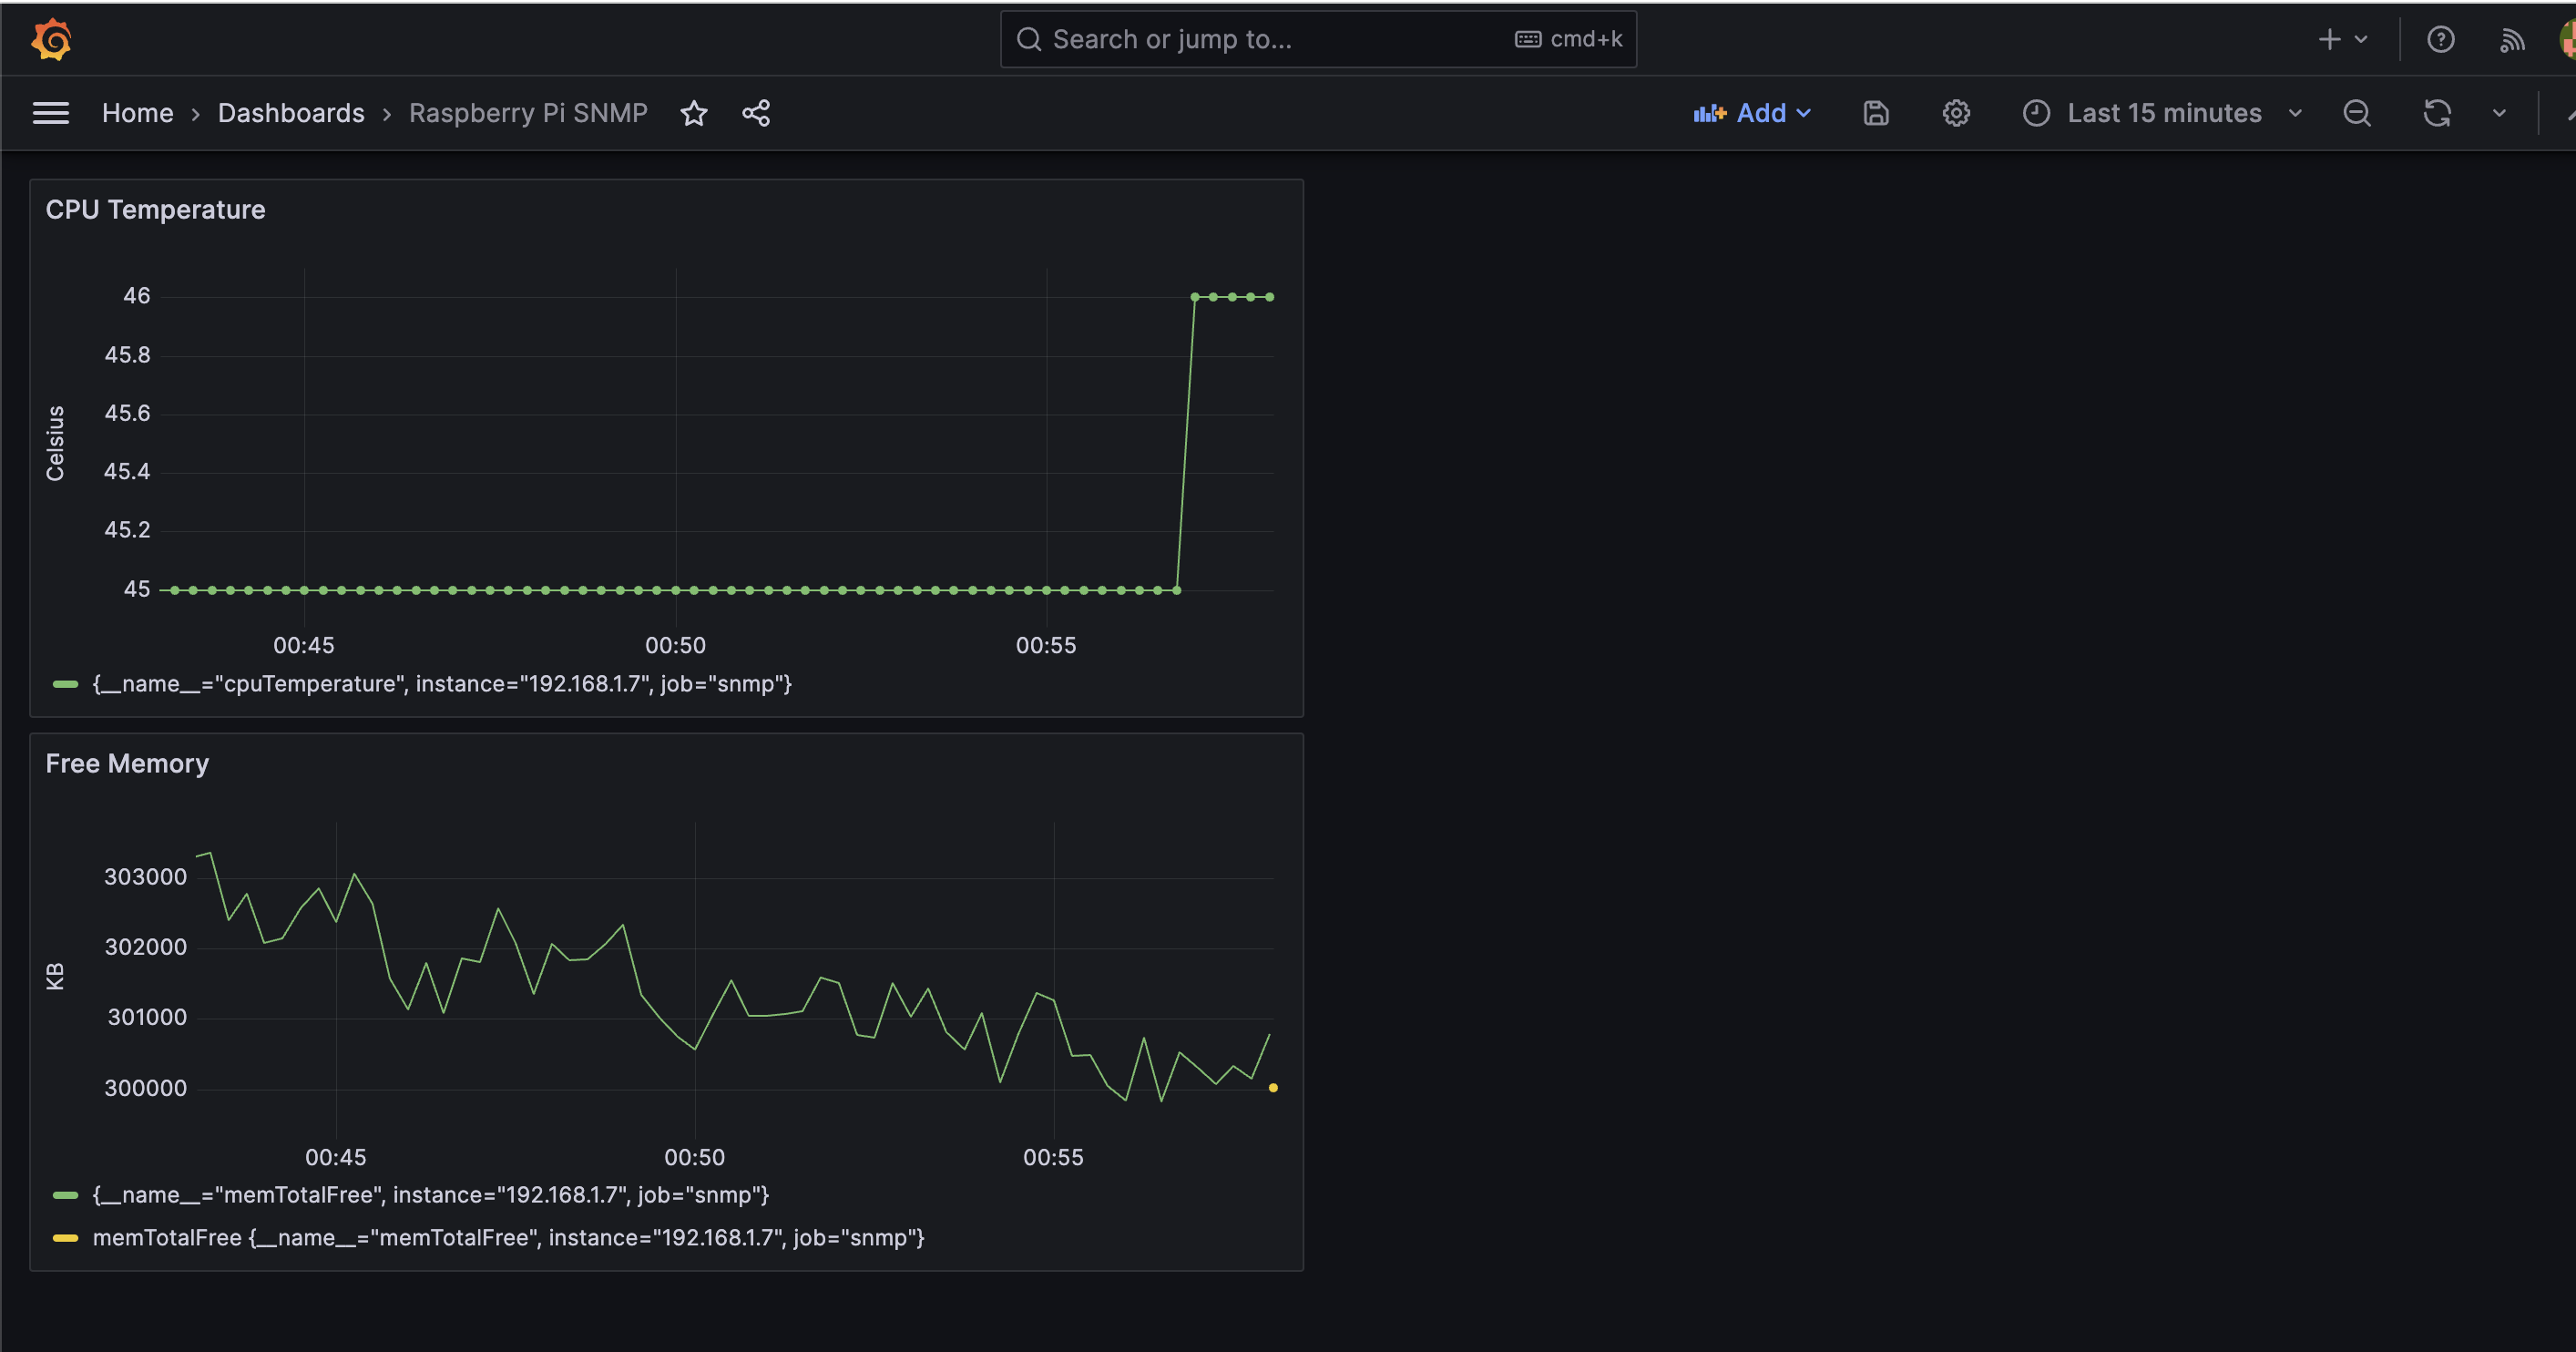
- Once you add and test your data source, you can then build your own dashboard based on the Prometheus queries. Mine looks like this.
End
- And that is it, we have created our own custom metric. Expose it on our own custom OID and display the data on Grafana throuh Prometheus. Thanks for reading and I hope you enjoy it!